1.Data preparation
The data file contains two columns: ① Gene Symbol;② Absolute value of log2FC(Prize value)
Upload Proteomics file OR paste in the box.
The file contains a tab-delimited list of proteins from proteomics data, with two columns: GeneSymbol, and Absolute value of log2FC of that protein in your experiment.
Upload mRNA file OR paste in the box.
The file contains a tab-delimited list of genes from expression data, with two columns: GeneSymbol and Absolute value of log2FC.
If you have data outside of the types listed here, feel free to create your own prize file your with data, and load using the Proteomics box. Prizes are generally between 0.5 and 2, with a higher prize more likely to be included in the solution (though the algorithm allows for any values).
2. Network construction
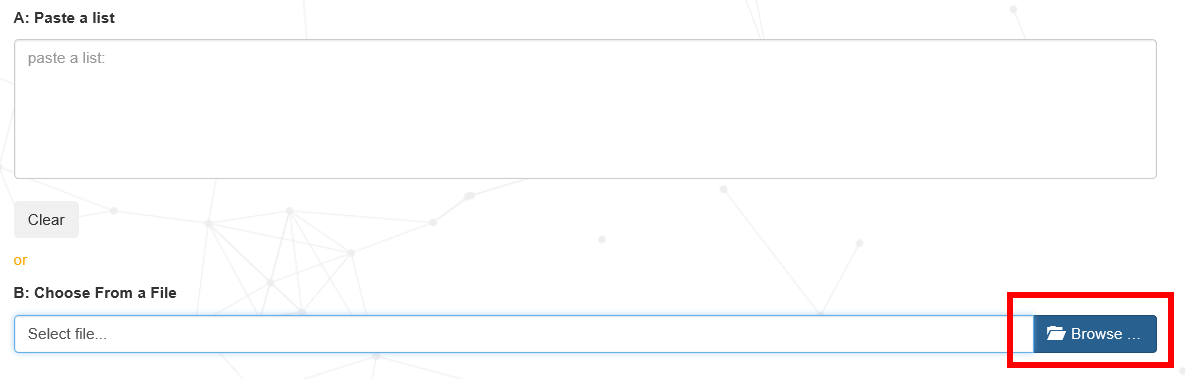
(1) Paste the data file into the data box or submit it in the form of a list.
(2) After clicking the Browse button, select the data file.
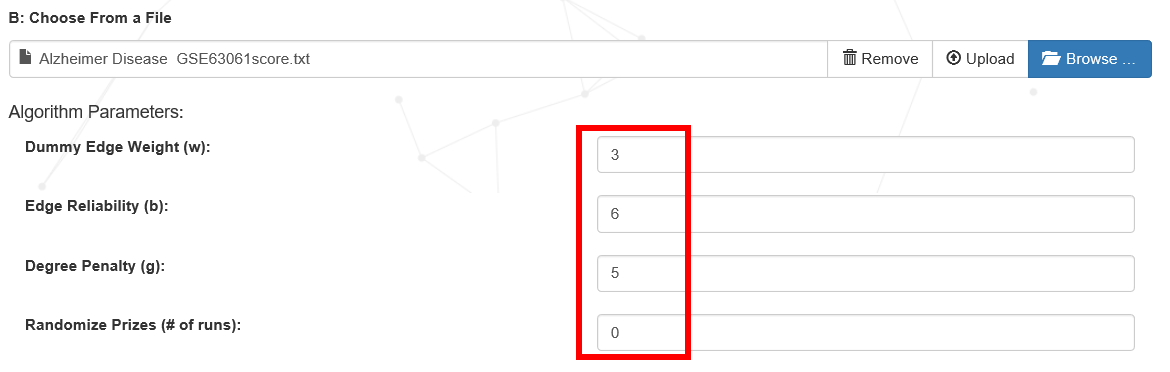
(3) Set the network extraction algorithm parameters (the proposed default parameters), if the network size is small, it is suggested to change the network parameters for more try to get the most suitable network for your work. The required parameters for the forest algorithm include Dummy Edge Weight (ω) (artificial edge cost, controls the number of the trees), Edge Reliability (β) (scaling factor for node prizes, controls the trade-off between including more terminals and using less reliable edges), and Degree Penalty (D) (depth of the final network, controls the maximum path-length from v0 to terminal nodes. Suggested values for D range between 5 and 10).
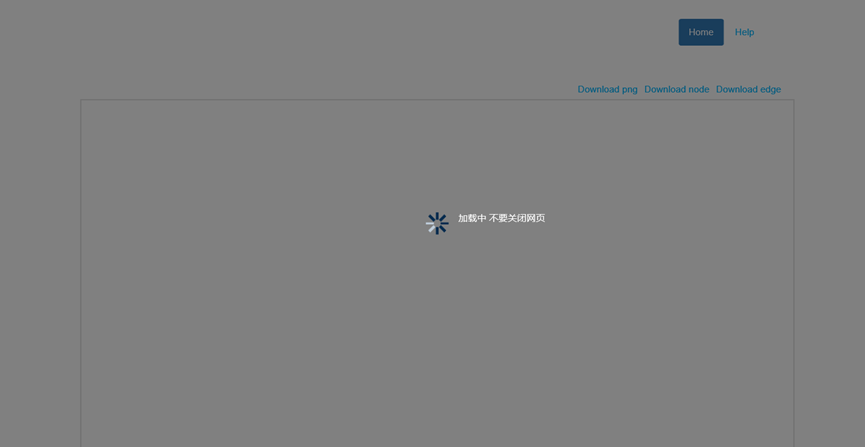
(4) Click on the submit button below to wait for the result. Please be patient and don't close the page. According to the size of the input data and the selected algorithm parameters, the time of network extraction is different. If the network is not displayed for a long time, the page can be refreshed, and the network diagram will be displayed in a few seconds.

The AD disease NIM subnetwork built with the default parameters in the sample data file
Note:
(1) when the above network diagram is viewed, we can use mouse middle roller to zoom, click the left mouse button to drag, and hold down the Ctrl+ left mouse button to select multiple nodes, then drag it. A display of the mechanism will appear when the mouse is hovering over the edge.
(2) the network graph is not good enough for webpage viewing. It is recommended to download data files (the upper right-hand side edge file and node attribute file) and visualize it locally.
3. Local visualization
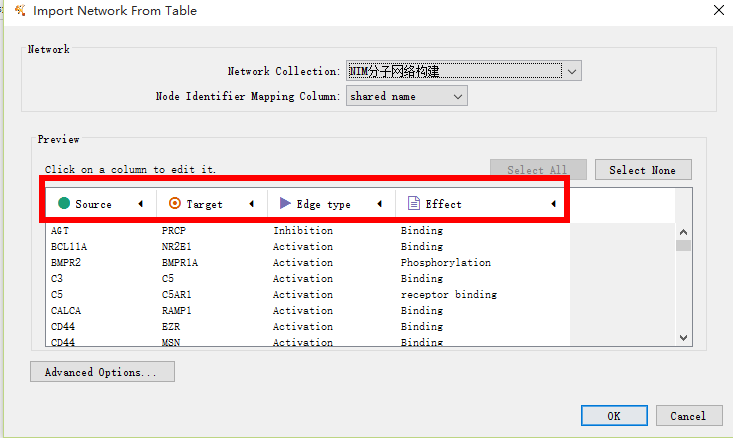
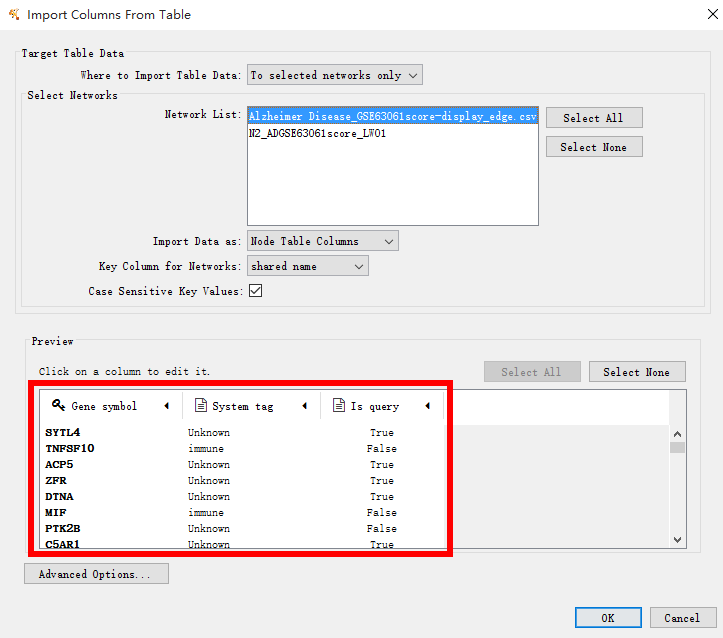
The commonly used software for complex network visualization is Cytoscape. To visualize the network in Cytoscape, open Cytoscape, select File > Import > Network > File..., select the network file (display_edge.csv) to open and click ‘OK’.
To view the node attributes, select File > Import > Table > File... and select the node attributes file (display_node.csv). The user can adapt the visualization of the nodes and edges using attributes files and alter the layout of the network.
Some local visulization advise:
(1) node color selection
(2) edge shape
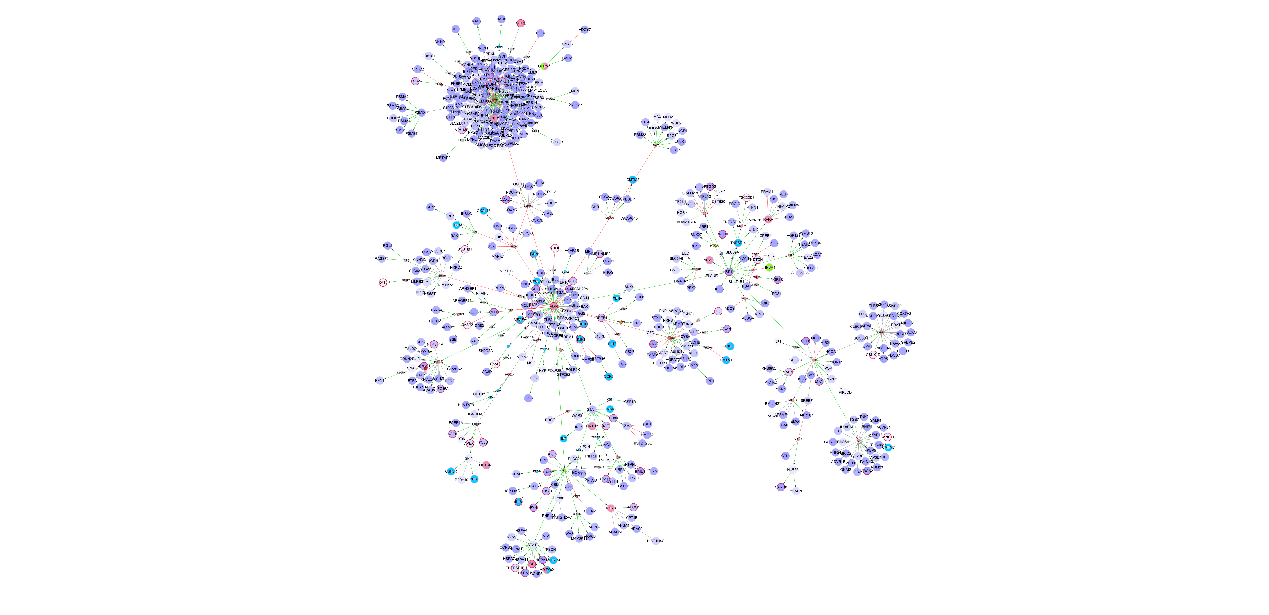
Local visualization for AD disease NIM subnetwork built with the default parameters in the sample data file.
In this network diagram, the significance of the difference in gene expression is demonstrated with purple color. The deeper in color, the greater the difference in significance.

This graph is a partial enlarged drawing of the upper
4. Complex network interpretation
The final results can be analyzed to mine key nodes and screening key modules by using complex network analysis algorithms. GO enrichment analysis and pathway enrichment analysis can also be used to explain the biological function.
5. Enrichment analysis
After got the NIM sub-networks, users can put the genes contained in them into the enrichment analysis tool in this page to obtain more comprehensive understanding. Such as the enrichment results for KEGG pathway, GO (Biological process, Molecular function, Cellular component), DO (Disease Ontology analysis)、Reactome pathway analysis.
As for the results of enrichment analysis, the following table list a summary information for them and the corresponding interpretation:
Summary information for enrichment analysis results.
| Result | Interpretation of results | Analysis with this result |
|---|---|---|
| Barplot | The bar chart shows the top 10 terms enriched. The horizontal axis represents the number of genes in each enriched terms. The color corresponds to the P value adjusted from small to large corresponding the color from red to blue. | KEGG, GO, DO, Reactome |
| Table | Detailed information of enriched terms | KEGG, GO, DO, Reactome |
| PlotGOgraph | The rectangle represents the enriched TOP 10 GO terms. The color is transited from yellow to red, and the corresponding p value is changed from large to small. It is displayed by GO hierarchical relationship. | GO |
| Emapplot | Nodes represent enriched terms and its size represents the number of genes enriched in this term. Color represents significant of the terms, and the thickness of the edge represents the number of genes in common between two terms. | KEGG, GO, DO, Reactome |
| Cnetplot | Grey nodes represent genes, yellow nodes represent the enriched terms, and the size corresponds to significant of the terms. | KEGG, GO, DO, Reactome |
Here we took the KEGG pathways enriched in NIM subnet of SLE as example to show the results corresponding to the results listed in the table. We can see that the top 7 most significant KEGG pathway of the NIM subnet of SLE are Hepatitis C (p.adjust=4.13E-10), Influenza A (p.adjust=1.41E-09), Osteoclast differentiation (p.adjust=2.33E-08), Kaposi sarcoma-associated herpesvirus infection (p.adjust=2.33E-08), Measles (p.adjust=2.33E-08), Epstein-Barr virus infection (p.adjust=6.35E-08), Chemokine signaling pathway (p.adjust=1.27E-07). If users want to take a more details eyesight into the distribution of the genes perturbed by SLE in a pathway, the KEGG pathway ID in the table can be clicked for more detailed information. Users can see the distribution of the seed genes from NIM subnets of SLE in KEGG pathways.
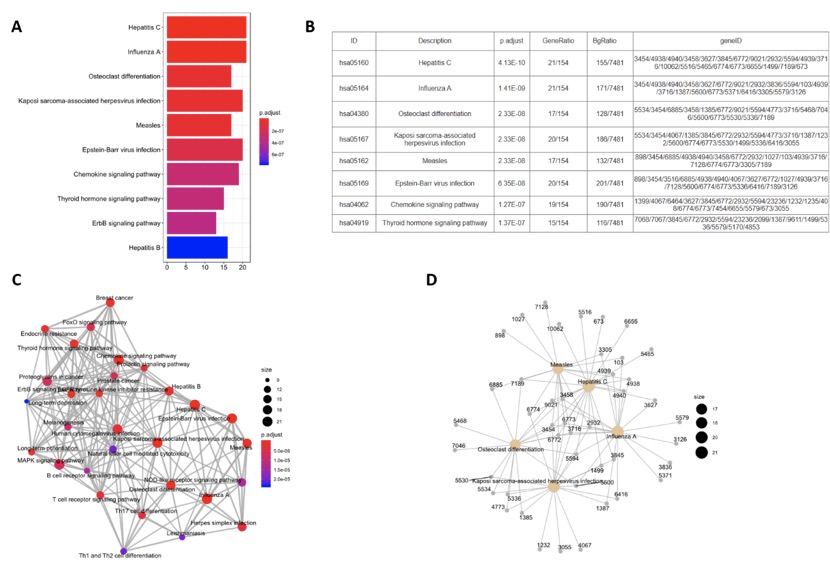
The results obtained from the enrichment analysis tools in NIMNT, taking KEGG pathway as example.(A) The barplot of KEGG pathway. (B) The table of KEGG pathway. (C) The emapplot of KEGG pathway. (D) The cnetplot of KEGG pathway.
With any technical question, you can send mail to:wangtongxing89@126.com or hanl06@qq.com